

Understanding the Dashboard and Map
The Dashboard summarizes your Timeline for the selected period. The map answers where you have been; the numeric cards answer how many days are recorded.
Start with the selected period
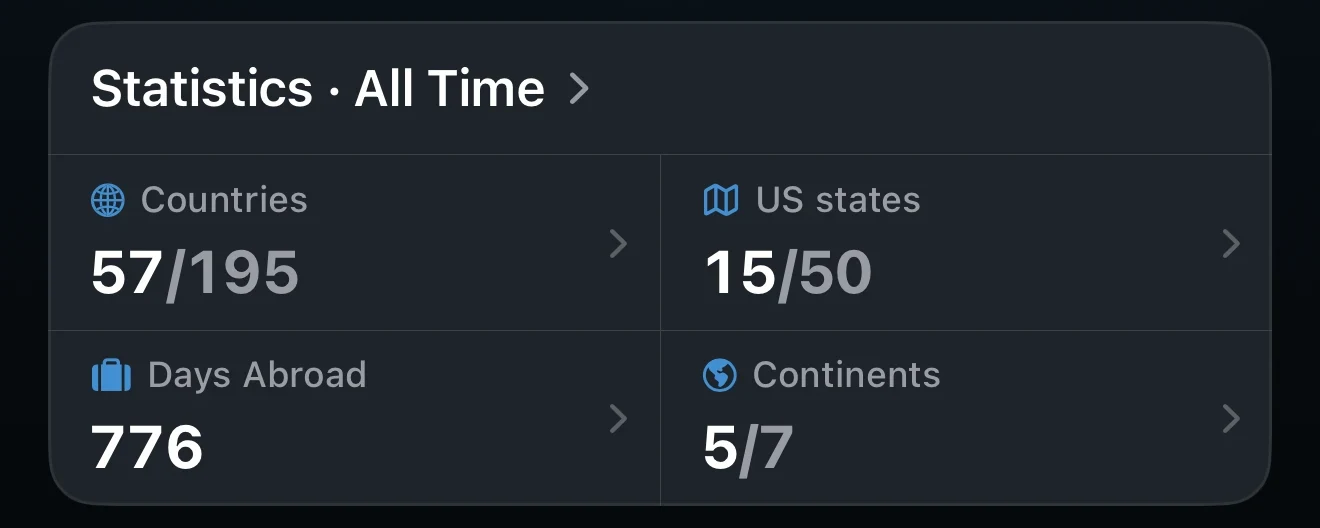
Tap the header of the Statistics card, which reads Statistics · followed by the period. It expands a control with Year and Range. Year offers All Time and one pill per year that has trips. Range offers recent spans of 7 to 365 days, and Custom for your own dates. Set the period before comparing a card with a trip or an export; different periods legitimately show different results. The map follows the same period.
The four statistics
Each cell opens a sheet with the detail behind it.
- Countries (labeled Places when your list includes territories) counts visited places against your Country Count list. Tap of N in the sheet to change the list, and use the sort menu to order by most trips, most days, or alphabetically.
- Days Abroad counts the days in the period spent outside your Home Country.
- US states counts visited states. It needs Pro and state-tagged US trips.
- Continents counts continents out of seven. Transcontinental countries can be assigned in Country Count.
Home Country and Days Abroad
Days Abroad counts days with exact dates in any place other than your Home Country. Set it in Settings → Tracking → Home Country, or from the Days Abroad sheet. Onboarding does not ask for it, so a new install starts as Not set, and the Days Abroad sheet then prompts you to set one. Choose No fixed residence to count every recorded day. Home Country also affects how the Add Tracker list is ordered and lets the Timeline hide home trips.
The map and totals answer different questions
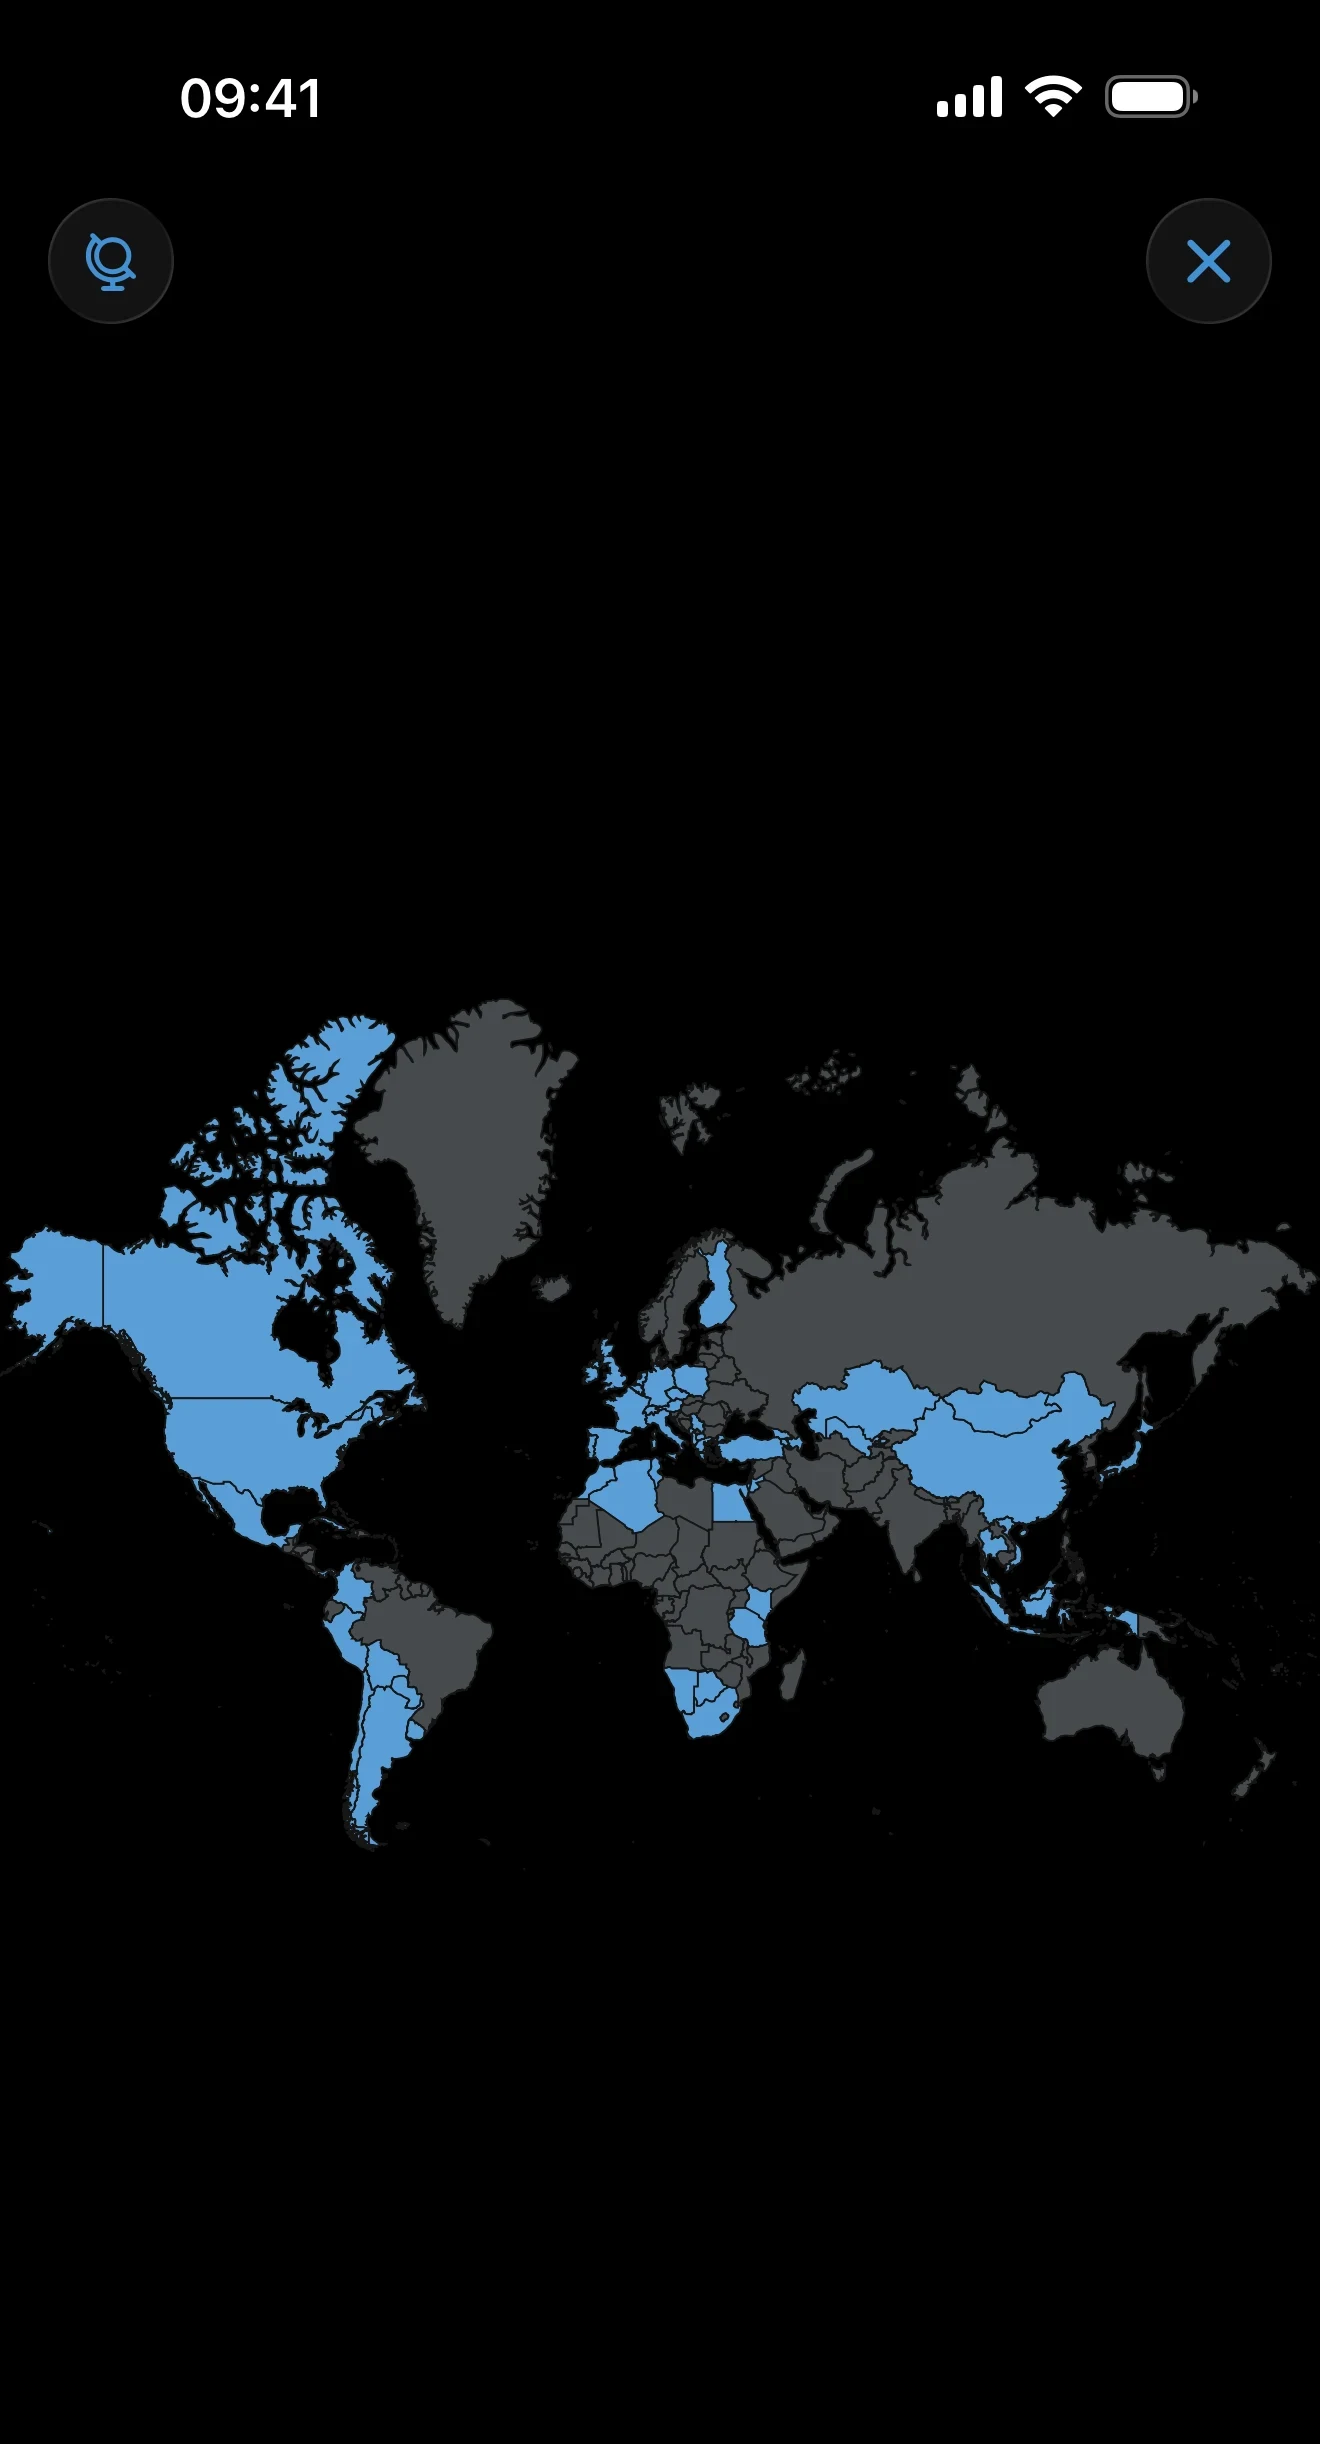
The map highlights every visited place that is not Transit, including places with no dates: a Year Only trip appears under All Time and for the year it names. Those trips create no day totals. The map can therefore show more places than the Countries statistic, which counts only your list.
Tap the map or pinch out to open the full-screen map. Drag to rotate the globe, pinch to zoom, and tap a country for its trips and days.
United States detail
A country-level United States trip highlights the US and contributes to US totals. State-level views need Pro and a state on the trip; an untagged US trip cannot be assigned to a state automatically.
Arrange the Dashboard and share it
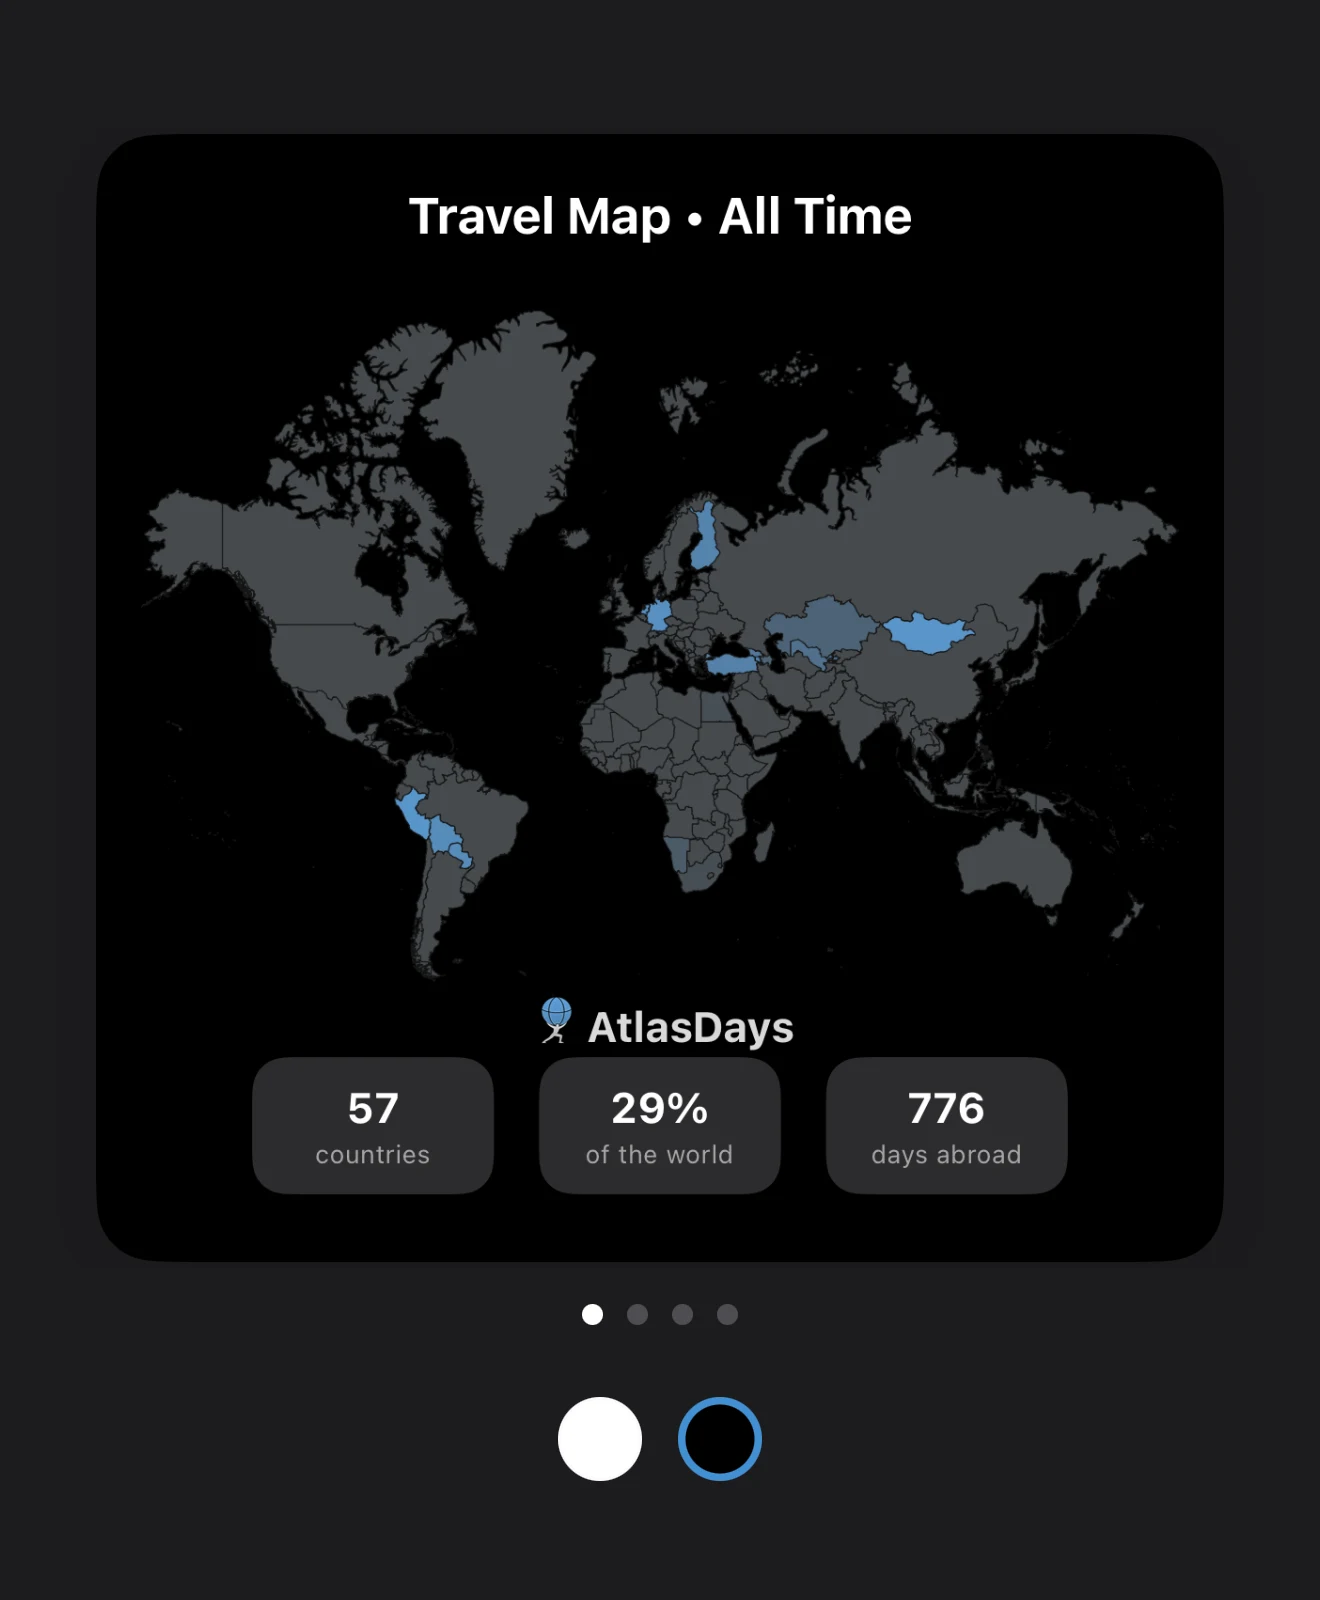
Long-press a tracker card to edit, reorder, or delete it. The share button at the top left opens cards you can save or send: Travel Map, Top Destinations, Continents, and Flags Collected. Review the period before sharing. The card appearance and language can be changed without touching your trips.
If a Dashboard card is surprising
Check the selected period first. Then open the Timeline and inspect the period's dated, Year Only, open-ended, and Transit trips, and verify Home Country, Country Count, and any missing US state tags.
Last updated September 30, 2026